
Was data manipulated to show the public a distorted picture of deaths/hospitalization from Covid?
A data analyst takes a closer look at raw Pandemic data from official reporting systems in Germany- his findings are quite revealing.

Marcel Barz is a Data Analyst & scientist who takes a look at raw data and numbers of the Covid19 pandemic. This analysis resulted in a video that we can warmly recommend to all fans of raw numbers. This video is about the number of deaths in Germany, the occupancy of intensive care beds, and the number of people infected. Marcel Barz reports on his experiences in life and parallels them to other historical events.
Video below in German, enable Auto translate+ Subtitles for English CC.
The professional Data analyst compares numbers from Germany’s official reporting system, “DIVI”: https://www.intensivregister.de/#/index
which is used for all official reporting in Germany.
He explains the step program used in his profession, to find out if data is being processed accurately, to not paint an inaccurate picture.
He shows an official analysis of excess deaths, as it is typically shown in the media:

A larger number is shown, with no relation or representation to the steadily growing population numbers.
He proceeds to follow his training to find figures concerning population numbers, categorized by age groups for better understanding. He shows the mortality rate from 2012- 2020 in Germany:

The results show a normal year, green numbers being represented as “lower” and red results as “higher” or worse.
His next question is how those numbers might compare to a country that used different protection and mitigation measures, such as Sweden. Germany had strong and consistent Lockdown measures in place, whereas Sweden did not:

The only number slightly above average in Sweden was in the 90 + Age category, putting it slightly ahead of 2012.
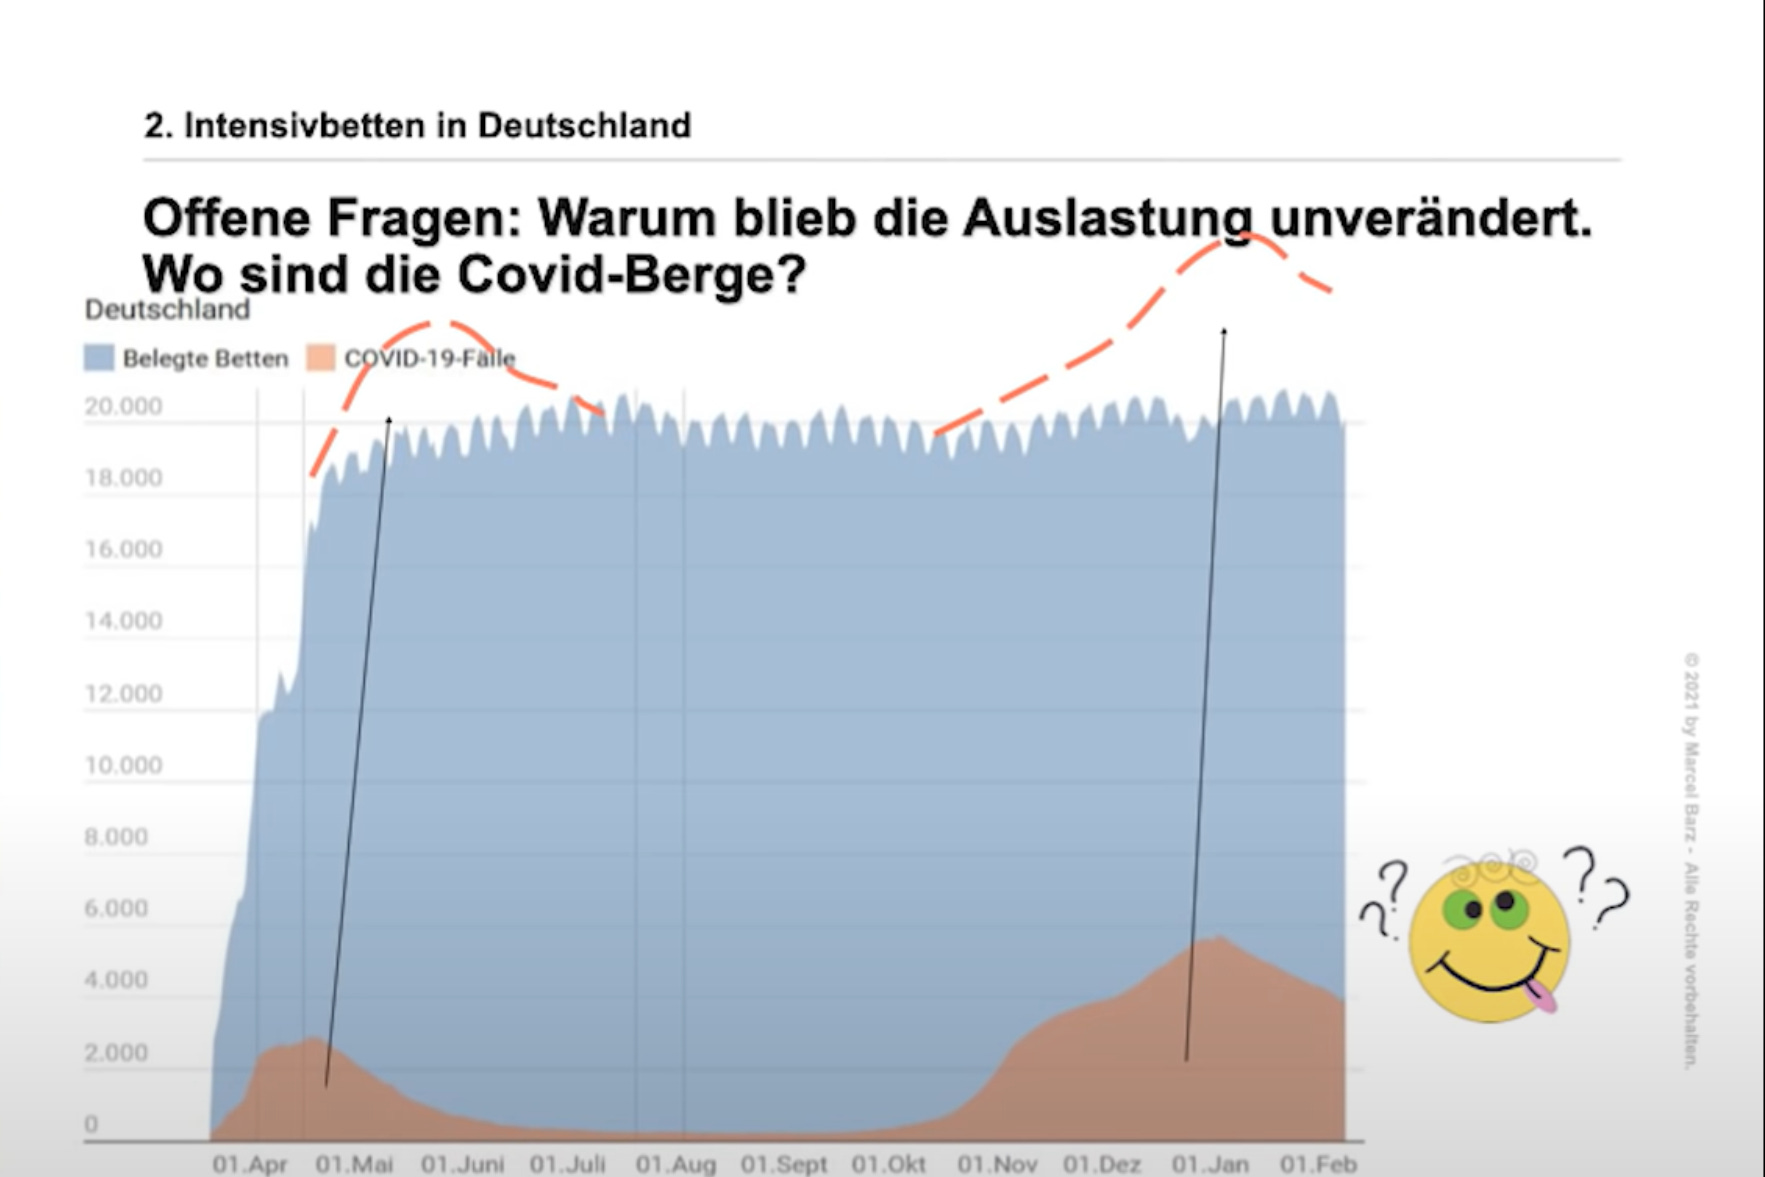
A Further category of data reviewed was the overall ICU bed occupancy by Covid patients.
Blue shows Occupied beds, Red symbolizes Covid19 Cases. They don’t seem to be correlated, the Blue line for occupancy stays steady throughout the year.
Another odd anomaly is found: In all of Germany, in November of 2020, a drastic reduction of hospital beds took place. They simply "dropped out" of existence for all official statistics. Many noticed this, and asked themselves: Why? Where did the beds go?

The answer seems to lie in financial Government incentives.
-The number of available ICU beds suddenly dropped by 6000.
-This made it seem like many hospitals’ ICUs were suddenly at capacity.
-The number of Covid patients in ICUs stayed at a static average of 4%.
-The Data did not determine if patients were admitted because of Covid, or if they happened to be tested positive for Covid during their stay for another ailment.
- Hospitals in Germany were compensated 10,2 Billion to reduce # of beds
-530 Billion were used as additional Incentives for utilizing Intensive Care beds more than previously

Marcel also reviewed PCR tests, in order to determine the number of infections and positive tests. After talking to Lab workers and Chemists, he came to the same conclusion that many of us reached, including the inventor of the PCR test, American biochemist Kary Mullis: PCR Testing is not an efficient way of measuring infection of a very specific pathogen. The tests are too HIGHLY sensitive to other viral particles, producing inconclusive results.
What does all this mean? One might say that those with decision making power in Governments are no stranger to this book:

-TamiCam